Build Your Own SIEM Stack with Open Source Tools Series
Intro to our Worlds Best SOC Built on Open Source Tools series.
PART ONE: Backend Storage
PART TWO: Log Ingestion
PART THREE: Log Analysis
PART FOUR: Wazuh Agent Install — Endpoint Monitoring
PART FIVE: Intelligent SIEM Logging
PART SIX: Best Open Source SIEM Dashboards
PART SEVEN: Firewall Log Collection Made Easy
PART EIGHT: Firewall Threat Intel With GreyNoise
INTRO
Hey Defenders, have you struggled with obtaining the proper insight into collecting, analyzing, and storing your security events? While there are plenty of commercial products on the market, these often come with high price tags. These high price points make it difficult for organizations to keep their environments secure while leaving room in the budget for R&D, marketing, and profit generating expenditures.

SOCFortress believes network security is a right, not a privilege.
This blog series will cover how you can build your own Open Source SOC!
Solution
What if we could combine the best of what Open-Source software has to offer to create a secure, robust, intelligent, and proactive cyber defense solution? Well that’s exactly what we decided to do. Why spend hundreds of thousand on security software when there are free tools out there for use? Use that saved money to increase R&D, hire better talent, or reach out to more potential customers. All with the peace of mind of a secure and certified (ISO, GDPR, SOC, etc.) environment.

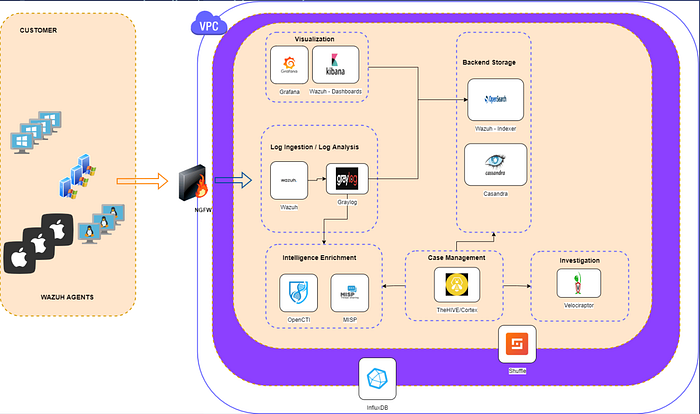
What Key Elements Make up A SIEM Stack?
We first need to understand what key pieces make up a SIEM stack and why. Without the proper tools in place, it will be difficult for our security team to detect, assess, triage, and respond to security events. This is especially true as your networks grow and the amount of ingested logs increases.
The below are key elements, in my opinion, that must be built into any SIEM stack.
- Log Ingestion
- Log Analysis
- Backend Storage
- Visualization
- Intelligence Enrichment
- Case Management
- Automation
- Investigation and Response
- Health Monitoring
Log Ingestion
Before our analysts can view security logs, we first need to ingest them. It is helpful to go through an exercise of determining what log sources you want to ingest. Common logs include:
- Endpoint Logs (Windows Events, Sysmon, Powershell logs, etc.)
- Network Devices (Firewalls (IDS/IPS), Switches, Access Points)
- Proxies (Apache, NGINX, etc.)
- 3rd Parties (AWS Cloud Trail, O365, Tenable, etc.)
As we start to ingest logs from multiple sources, it is crucial for us to ensure our logs are being normalized to common field names. For example, source_ip , source_ipv4_ip should both be rewritten to a src_ip field. This will save us time and energy later as we start to develop dashboards and alerting strategies.
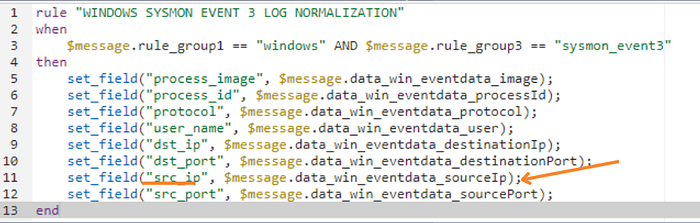
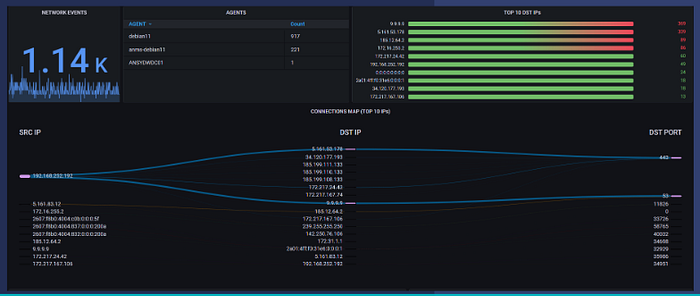
With log normalization we can now build a universal dashboard that displays all network connections regardless of the source we collected the log from.
Graylog
Graylog is our tool of choice when it comes to log ingestion. Graylog is responsible for collecting logs from various log sources:
- Wazuh Manager
- Network Devices
- Syslog Forwarders from 3rd parties (Cylance, Crowdstrike, etc.)
- And a ton more!
Graylog also handles index management of indices that are stored within the Wazuh-Indexer backend to fit the index lifecycle of choice.
Log Analysis
While collecting a wealth of logs is a good starting point, we need to be able to analyze the meta details within our collected logs to accurately build alerting and prioritize our security events. For example, maybe I want to detect when powershell was invoked with the -ExecutionPolicy Bypass flag.
- Analyze logs received from endpoints / services.
- Determine the severity of the logs ingested via log analysis. Supported ability for custom rules.
- Ability to discard noisy alerts to limit overflow of unnecessary data.
All networks are different and having the flexibility to create your own custom rules is a must.
You can get started with our publicly provided Wazuh custom rules on your own: FREE Advanced Wazuh Detection Rules.
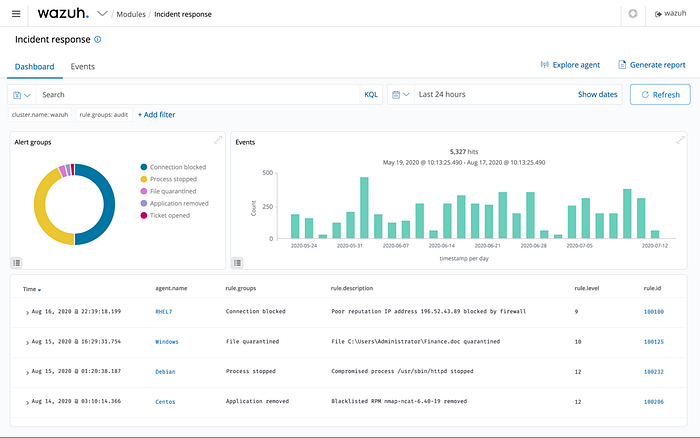
Wazuh
Wazuh is a great tool that allows us to not only collect logs from our endpoints, but comes built with baked in rules that analyze the contents of our logs to detect attacks.
Wazuh also provides:
- Configuration Assesssment
- File Integrity Monitoring
- Vulnerability Detection
- And much more!
Backend Storage
Ingesting and analyzing logs is great, but where are those logs going to be stored? It is imperative for us to provide a backend storage architecture that allows for:
- Storing, searching, and viewing of data (our collected security events)
- High Availability
- Robust performance
- Ability to scale
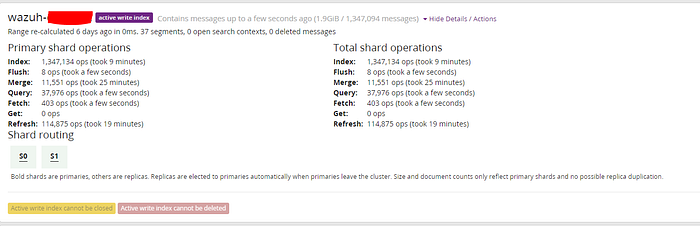
Wazuh-Indexer
The Wazuh-Indexer which is Wazuh’s forked version of OpenSearch allows us to do just that. It’s feature rich API also allows us to plug other tools into the Wazuh-Indexer stack such as Grafana, Elastalert, etc.
Visualization
Storing our logs is only one piece of the puzzle. Without a way for our SOC analysts to easily view, pivot, triage, and search for security threats, or stack is really no good. We would suffer a slow death of exhaustion trying to shift through all these logs trying to find the needle in a haystack.
Our visualization tools must give us the ability to:
- View logs via widgets / dashboards / etc.
- Fast searching and viewing of data.
- Support the ability to read from multiple log storages (Wazuh-Indexer, csv files, MySQL, etc.)
Grafana
Grafana is our recommended choice when it comes to our visualization tool. Grafana is lightening quick (compared to Kibana), fully customizable, rich with pre built widgets, backed by a strong community, and offers multi tenant support!
Grafana allows us to build out a “single pane of glass” approach to view all of our security events.
Intelligence Enrichment
Apart from just analyzing our logs, we need a way to enrich our logs with intelligence to help our analyst quickly spot potential malicious activity. For example, is this IP address that I see interacting with my website malicious or not? We need a solution that can:
- Enrich received logs with threat intelligence gathered from various providers.
- Parse and store selected responses so that only crucial data is stored.
- Automated so that your SOC analysts are not having to manually attempt to enrich received logs.
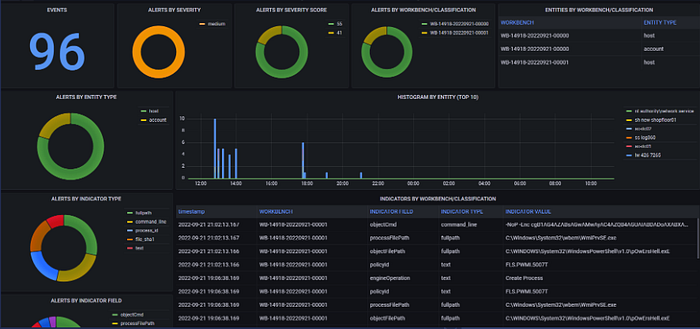
OpenCTI
The first purpose of the OpenCTI platform is to provide a powerful knowledge management database with an enforced schema especially tailored for cyber threat intelligence and cyber operations.
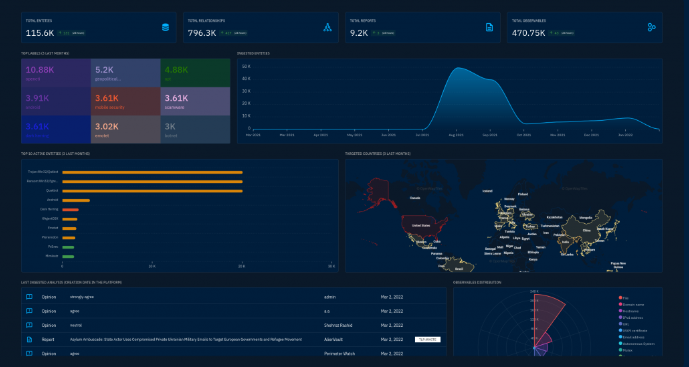
MISP
MISP provides metadata tagging, feeds, visualization and even allows you to integrate with other tools for further analysis thanks to its open protocols and data formats.

Both tools offer a rich API that allows us to automate threat intel lookups on the fly!
Case Management
As the SOC team grows, we need to provide a platform that allows them to collaborate, enrich, and respond to alerts. Providing playbooks, tasks, and procedures for your SOC analysts will help guide them through alerts detected and allow them to focus on CRITICAL alerts.
- Platform to view and react to HIGH severity events.
- Allow collaboration with multiple SOC analysts.
- Allow responsive actions so that analysts can trigger events on their endpoints.

TheHIVE/Cortex
TheHIVE gives us the ability to manage, organize, correlate your incidents and automate your forensics analysis while leveraging a powerful collaborative capability.
While Cortex provides investigation of observables (file hashes, IPs, domains, etc.) from third party or legacy services and automated active response.
Automation
As our log collection increases, we need a tool that can automate many of our tasks such as:
- Case creation
- Phishing analysis
- Failed healthchecks
- Report generation
- Literally anything :)
All tools mentioned in this post give provide their own API which we can plug our SOAR platform into to automate anything and everything!
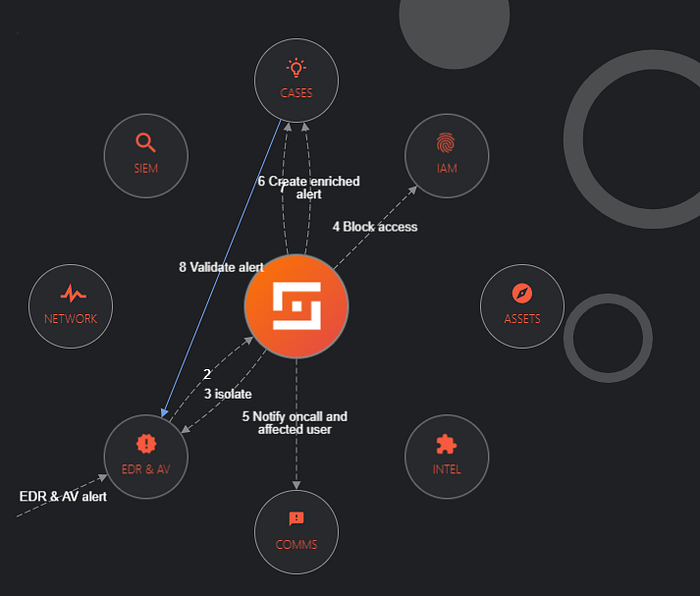
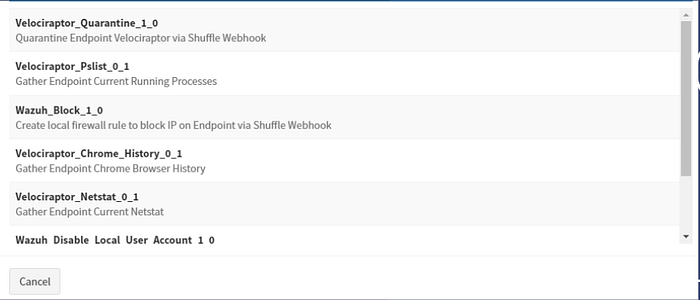
Shuffle
Shuffle is an Open Source interpretation of SOAR. It aims to bring all the capabilities necessary to transfer data throughout an enterprise with plug-and-play Apps, making automation approachable for everyone. It should remove the need for a coder on the team (I still suggest having at least one..), empowering everyone by being able to deploy new, complicated (or simple) workflows in minutes rather than hours or days.
Follow Frikky’s blog series for a deeper dive into Shuffle before we explore it on our own :)
Investigation
Receiving alerts is only half the battle, we must provide our SOC analysts with the ability to thoroughly investigate alerts by interacting with the monitored endpoints in a manner that is scalable and fast. Some techniques include:
- Listing running processes
- Enumerating logged in users
- Detect listening ports
- View downloaded files
- Quarantining a device
- And much more!

Without this ability, it is difficult for our SOC analyst to quickly assess the actual severity of an alert.
Velociraptor
Velociraptor is an advanced digital forensic and incident response tool that enhances your visibility into your endpoints. At the press of a (few) buttons, we can perform targeted collection of digital forensic evidence simultaneously across our endpoints, with speed and precision. Their solid API allows us to automate and trigger evidence collection when we need it.
Health Monitoring
With our stack now built it out, we need to monitor the health of our overall SIEM stack to ensure smooth operations and minimize the risk of missing alerts. I like to think of monitoring in two phases:
- Endpoint resources (CPU, RAM, Disk, Processes, etc.)
- WebUI uptime
For example, maybe the Grafana service is running just fine, but there was a firewall change made that prohibits users from accessing the Grafana WebUI. While Grafana itself is healthy, our analysts would be unable to view alerts without access to the WebUI and ultimately rendering Grafana useless until the issue is resolved.
InfluxDB/Telegraf
InfluxDB combined with the Telegraf agent allows us to collect all endpoint metrics and offers built in alerting for when thresholds are met or critical processes (such as the wazuh-indexer) are not running. This allows our engineering team to proactively respond to potential issues before they escalate to a serious impact.
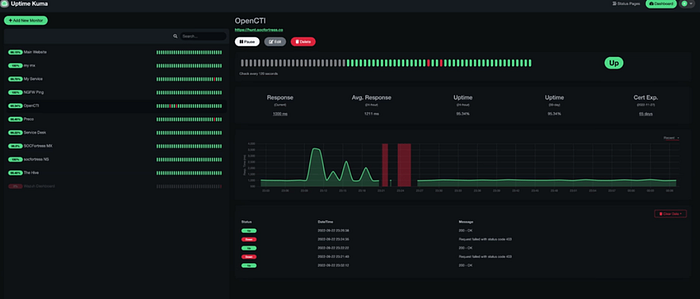
Uptime Kuma
Uptime Kuma is a monitoring tool that you can use to monitor websites and applications in real time. Features include:
- Monitors uptime for HTTP(s) websites, TCP Ports, and Docker containers and retrieves information such as DNS records.
- Sends notifications via Email (SMTP), Telegram, Discord, Microsoft Teams, Slack, Promo SMS, Gotify, and 90+ notification services.
- Supports multiple languages.
- Provides multiple Status Pages.
- Provides Proxy Support.
- Displays SSL certificate information.
- Maps Status Page to Domain.
Conclusion
Security is no easy task. Nor does it have to break the bank. There are a wealth of Open Source tools available for us to build our own SIEM stack with minimal cost. The flexibility of Open Source also allows us to customize anything and everything that pertains to your unique networks and needs. Throughout this series we will be deep diving into each of these tools to help serve as a guide as you start to build our own in house SOC that is up to par with commercial tools currently on the market.
Our deployment strategy (coming in future posts) will be as followed:
- Wazuh Indexer (OpenSearch)
- Wazuh Dashboards (OpenSearch Dashboards)
- Graylog
- Wazuh Manager / Agents
- Grafana
- MISP
- OpenCTI
- TheHIVE / Cortex
- Velociraptor / Agents
- Shuffle
- InfluxDB / Telegraf
- Uptime Kuma
We cannot wait to see you guys there…happy defending :)
Need Help?
The functionality discussed in this post, and so much more, are available via the SOCFortress platform. Let SOCFortress help you and your team keep your infrastructure secure.
Website: https://www.socfortress.co/
Platform Demo: https://www.socfortress.co/demo_access.html