Part 9. Log Normalization
Applications and Vendors and Custom Logs, oh my!
PART ONE: Backend Storage
PART TWO: Log Ingestion
PART THREE: Log Analysis
PART FOUR: Wazuh Agent Install
PART FIVE: Intelligent SIEM Logging
PART SIX: Best Open Source SIEM Dashboards
PART SEVEN: Firewall Log Collection Made Easy
PART EIGHT: Firewall Threat Intel With GreyNoise
Intro
Throughout this series we have started ingesting Wazuh logs from our Windows and Linux endpoints (PART 4) and from a pfSense Firewall (PART 7) into our SIEM stack.

In PART 6, we created our first dashboard within Grafana to detail Network Connections made by our endpoints.

However, this only details network connections made by our Windows endpoints.
So What’s The Problem?
Dashboards are built by selecting our key fields from our raw logs to display via Grafana Panels. For example, the key field detailing the destination IP address that our Windows endpoint connected to is stored within data_win_eventdata_destinationip .

data_win_eventdata_destinationipWhere if we look invoke a network connection via our Linux endpoint, we notice the destination IP is stored within the key field: data_eventdata_DestinationIp .

data_eventdata_DestinationIpWhile the difference is subtle, this makes our lives as SOC engineers difficult because we cannot create universal dashboards or alerts that pertain to network connections made by either a Windows or Linux endpoint.
We would have to double our efforts to create 2 Dashboards (Linux and Windows Network Connections) and 2 Alerts (Linux and Windows Network Connections). We need a way to standardize our log fields so that common fields, such as fields containing destination IP addresses, are always written to the same field name regardless of the log source (Linux / Windows / MacOS / etc.)
Log Normalization To The Rescue
To combat this issue, we take advantage of Graylog’s Pipeline rules to rewrite our unique field names, such as data_win_eventdata_destinationip and data_eventdata_DestinationIp , to a universal field name dst_ip .
Create a Pipeline Rule
Using a pipeline rule, we instruct Graylog to create a new field, dst_ip , that contains the same value of that we received via our data_win_eventdata_destinationip and data_eventdata_DestinationIp . This then allows us to create just 1 dashboard that refelcts just contents of the dst_ip field rather than having to create 2 dashboards for our data_win_eventdata_destinationip and data_eventdata_DestinationIp fields.
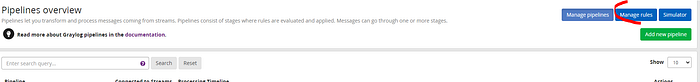
- Select System -> Pipelines -> Manage rules
2. Create a LINUX SYSMON EVENT 3 LOG NORMALIZATION rule:
rule "LINUX SYSMON EVENT 3 LOG NORMALIZATION"
when
    $message.rule_group1 == "linux" AND $message.rule_group3 == "sysmon_event3"
then
    set_field("process_image", $message.data_eventdata_image);
    set_field("process_id", $message.data_eventdata_processId);
    set_field("protocol", $message.data_eventdata_protocol);
    set_field("user_name", $message.data_eventdata_user);
    set_field("dst_ip", $message.data_eventdata_DestinationIp);
    set_field("dst_port", $message.data_eventdata_destinationPort);
    set_field("src_ip", $message.data_eventdata_sourceIp);
    set_field("src_port", $message.data_eventdata_sourcePort);
end
3. Apply then Save and Close
4. Create a WINDOWS SYSMON EVENT 3 LOG NORMALIZATION rule:
rule "WINDOWS SYSMON EVENT 3 LOG NORMALIZATION"
when
    $message.rule_group1 == "windows" AND $message.rule_group3 == "sysmon_event3"
then
    set_field("process_image", $message.data_win_eventdata_image);
    set_field("process_id", $message.data_win_eventdata_processId);
    set_field("protocol", $message.data_win_eventdata_protocol);
    set_field("user_name", $message.data_win_eventdata_user);
    set_field("dst_ip", $message.data_win_eventdata_destinationIp);
    set_field("dst_port", $message.data_win_eventdata_destinationPort);
    set_field("src_ip", $message.data_win_eventdata_sourceIp);
    set_field("src_port", $message.data_win_eventdata_sourcePort);
end
5. Apply then Save and Close
6. Select the GeoIP Pipeline that we configured in PART 6.
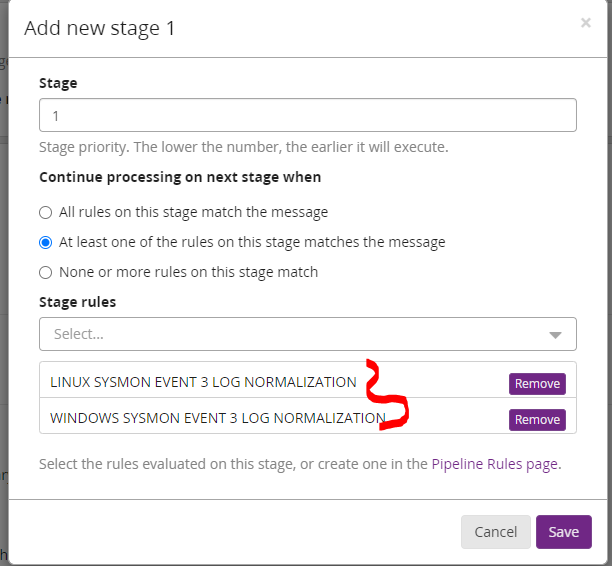
7. Add a new stage and select our newly created rules

Viewing Results
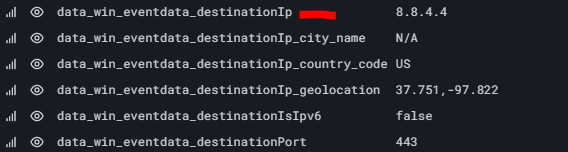
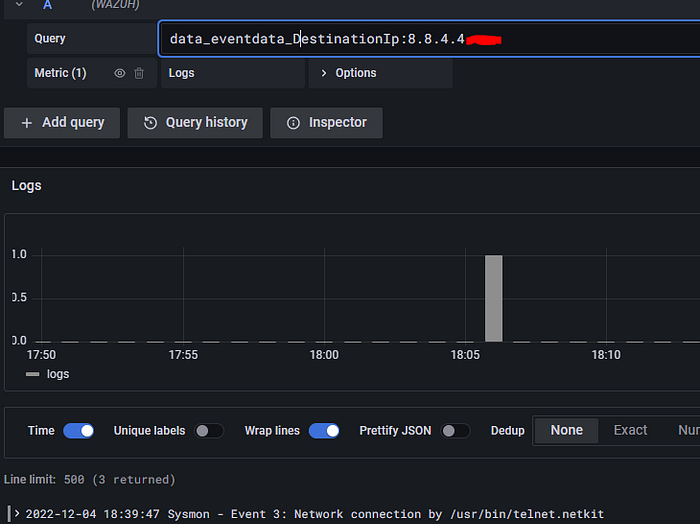
Now let’s generate a network connection via our Linux endpoint to 8.8.4.4 and view our results within Grafana.


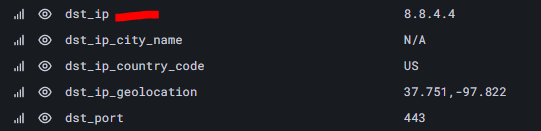
The above 2 images display that Graylog has now added our new normalized field dst_ip with the same value that was contained within the data_eventdata_DestinationIp field.
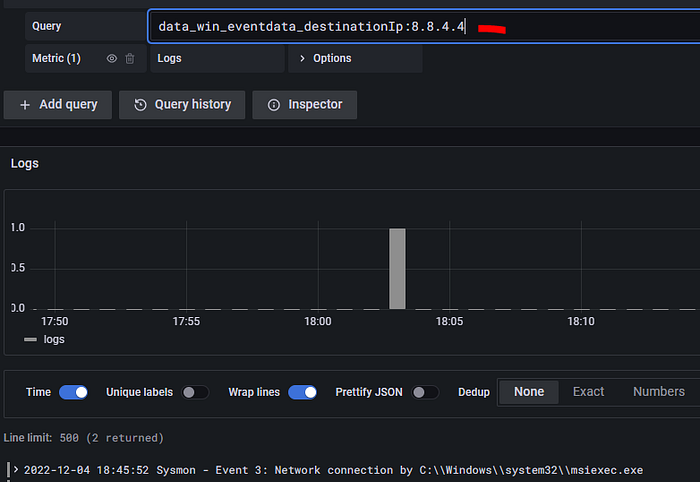
Let’s do the same on our Windows endpoint.
The above 2 images display that Graylog has now added our new normalized field dst_ip with the same value that was contained within the data_win_eventdata_destinationIp field.
We can now build a search query for dst_ip:8.8.4.4 to see any Linux or Windows endpoint that invoked a network connection to 8.8.4.4 .
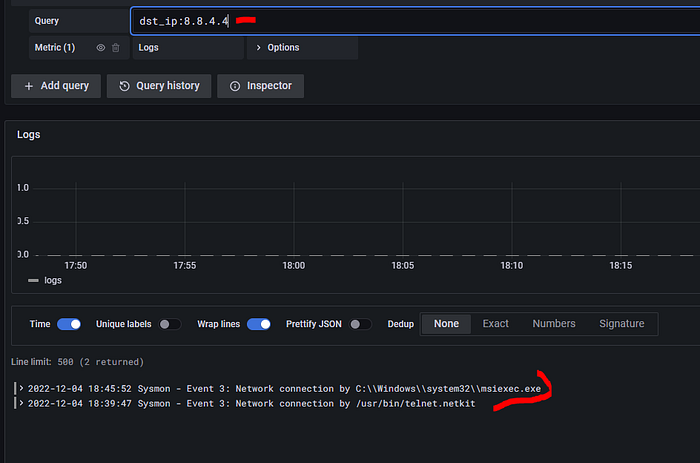
Before our field normalization, we had to write 2 different search queries to achieve the same results, data_win_eventdata_destinationIp:8.8.4.4 and data_eventdata_DestinationIp:8.8.4.4 .
Conclusion
Unfortunately, there is no common standard when it comes to how developers and vendors output common field names within their logs. This results in increased time and effort for our SOC analysts to pinpoint activity that want to quickly spot, such as the question What endpoints connected to IP address 8.8.4.4?
With Graylog’s Pipeline rules we enforce log normalization to follow our own internal naming convention and set standards to how SOC analyst can run searches and view results within the SIEM platform. So what are you waiting for? Take control over your SIEM logs no matter of the log source with Log Normalization today! Happy Defending 😄.
Need Help?
The functionality discussed in this post, and so much more, are available via SOCFortress’s Professional Services. Let SOCFortress help you and your team keep your infrastructure secure.
Website: https://www.socfortress.co/
Professional Services: https://www.socfortress.co/ps.html